How to emulate different types of users?
When emulating a real user, you need to consider the user’s actual behavior.
Behavior refers to the time that a user takes to pause between actions, the number of times a user repeats an action, and so on.
1 Open the run-time settings.
In the Design tab, select the script and click the Run-Time Settings button.
The run-time settings are displayed.Run
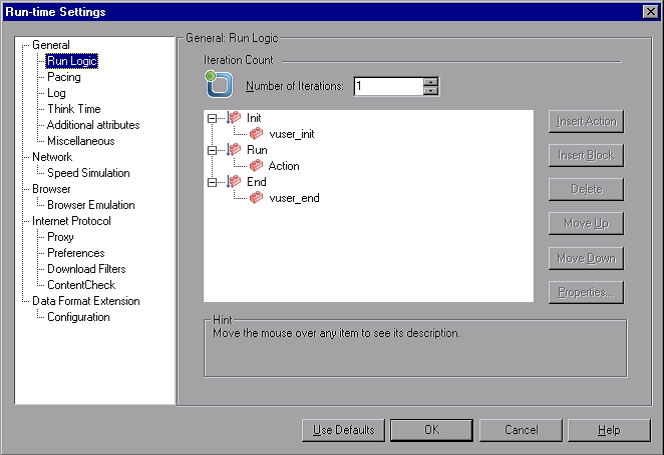
The run-time settings let you emulate different kinds of user activity and behavior. They include:
- Run Logic. The number of times a user repeats a set of actions.
- Pacing. The time to wait before repeating the action.
- Log. The level of information that you want to gather during the test.
The first time you run a scenario, it is recommended to generate log messages to make sure that you have debugging information in case the first run fails.
- Think Time. The time the user stops to think between steps.
Since users interact with the application according to their experience level and objectives, more technically proficient users may work more quickly than new users. Vusers can be made to emulate their real-world counterparts more accurately during a load test by enabling think time.
- Speed Simulation. Users using different network connections such as modem, DSL, and cable.
- Browser Emulation. Users using different browsers to see their application’s performance.
- Content Check. For automatically detecting user-defined errors.
Suppose that your application sends a custom page when an error occurs.
This custom page always contains the words ASP Error. You need to search all of the pages returned by the server and see if the text ASP Error appears.
You can set up LoadRunner to automatically look for this text during the test run, using the Content Check run-time settings. LoadRunner searches for the text and generates an error if it is detected. During the scenario run, you can identify the content check errors.
2 Enable think time
Select the General: Think Time node. Select Replay think time, and select the Use random percentage of recorded think time option. Specify a minimum of 50% and a maximum of 150%.
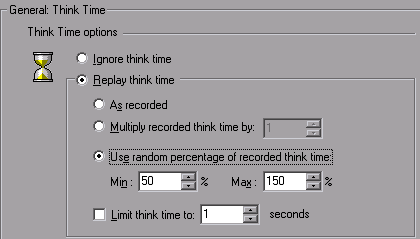
You use a random percentage of the recorded think time to emulate users with a varying range of proficiency. For example, if the recorded think time for selecting a flight was 4 seconds, the random think time could be anything between 2-6 seconds (50% to 150% of 4).
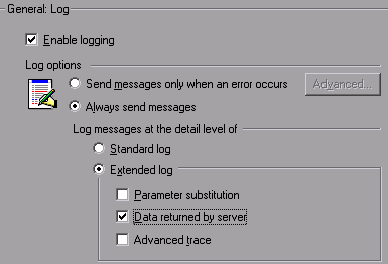
3 Enable logging
Select the General:Log node, and select Enable logging. In the Log options, select Always send messages. Select Extended log, and select Data returned by server or parameter substitution.
Controller Run View
The Run tab in the Controller window is the control center from which the test is managed and monitored. The Run view contains five main sections:
➤ Scenario Groups pane
➤ Scenario Status pane
➤ Available Graphs Tree
➤ Graph Viewing Area
➤ Graph Legend
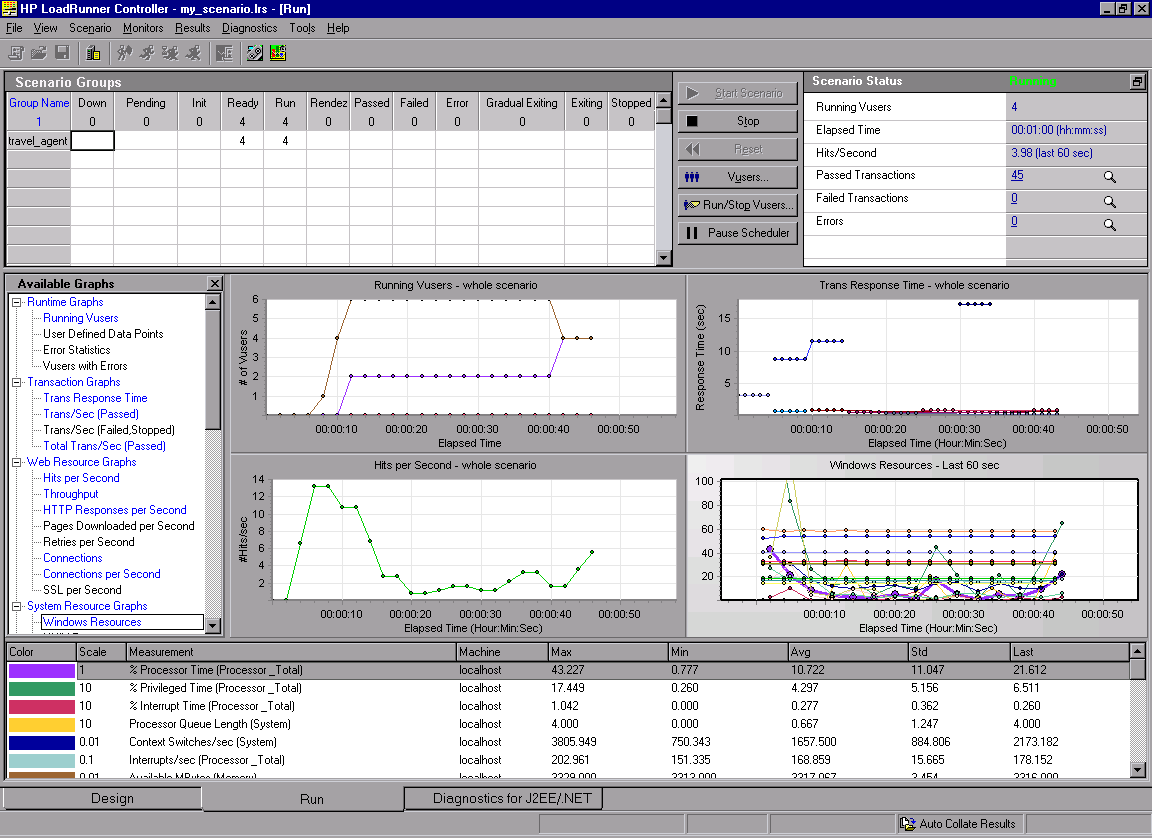
Scenario Groups pane
In the upper-left pane, you can view the status of Vusers in the scenario groups. You use the buttons to the right of this pane to start, stop, and reset the scenario, to view individual Vuser status, and to increase the load on the application during a scenario by manually adding more Vusers.
Scenario Status Pane
In the upper-right pane, you can view a summary of the load test, including the number of running Vusers and the status of each Vuser action.
Available Graphs Tree
In the middle-left pane, you can see a list of the LoadRunner graphs. To open a graph, select a graph in the tree, and drag it into the graph viewing area.
Graph viewing Area
In the middle-right pane, you can customize the display to view between one and eight graphs (View > View Graphs).
Graph Legend
In the bottom pane, you can view data from the selected graph.
| About Load Runner | Creating scripts in Load Runner | Load Runner scenario | LR Analysis | Performance Tuning | Performance Testing | LR Errors | Interview Question | Load Runner Tool | Correlation Practice | Site Map |