Controller: Did the application encounter errors during load test?
If an application starts to fail under heavy load, you are likely to encounter errors and failed transactions. The Controller displays error messages in the Output window.
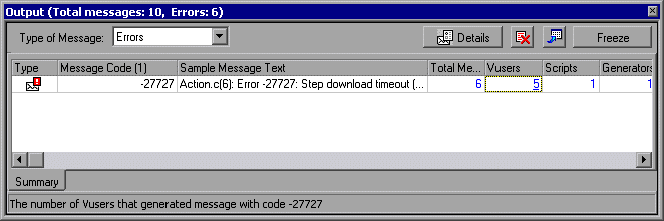
1 Check for any error messages.
Select View > Show Output or click Errors in the Scenario Status pane.
The Output dialog box opens and lists a message text, the total number of messages generated, the Vusers and load generators that generated the error, and the scripts in which the errors occurred.
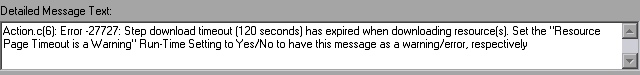
To view a message in detail, select the message and click Details. The Detailed Message Text box opens, displaying the complete message text.
The example below shows a timeout error. The Web server did not respond to a request within a given time period.
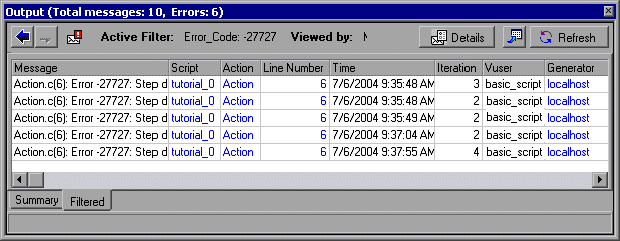
2 View log information details
You can view information about each message, Vuser, script, and load generator associated with an error code by clicking the blue link in the appropriate column.
For example, to locate where in the script an error occurred, drill down the Total Messages column. The Output window displays a list of all messages of the selected error code, including the time, iteration number, and line in the script where the error occurred.
VuGen opens, displaying the line in the script at which the error occurred. You can use this information to identify transactions with slow response times that are causing the application to fail under load.
| About Load Runner | Creating scripts in Load Runner | Load Runner scenario | LR Analysis | Performance Tuning | Performance Testing | LR Errors | Interview Question | Load Runner Tool | Correlation Practice | Site Map |