Loadrunner Analysis : How does an analysis session work?
The aim of the analysis session is to find the failures in your system’s performance and then pinpoint the source of these failures, for example:
- Were the test expectations met? What was the transaction response time on the user’s end under load? Did the SLA meet or deviate from its goals? What was the average transaction response time of the transactions?
- What parts of the system could have contributed to the decline in performance? What was the response time of the network and servers?
- Can you find a possible cause by correlating the transaction times and backend monitor matrix?
In the following sections, you will learn how to open LoadRunner Analysis, and build and view graphs and reports that will help you find performance problems and pinpoint the sources of these problems.
The Analysis window at a glance
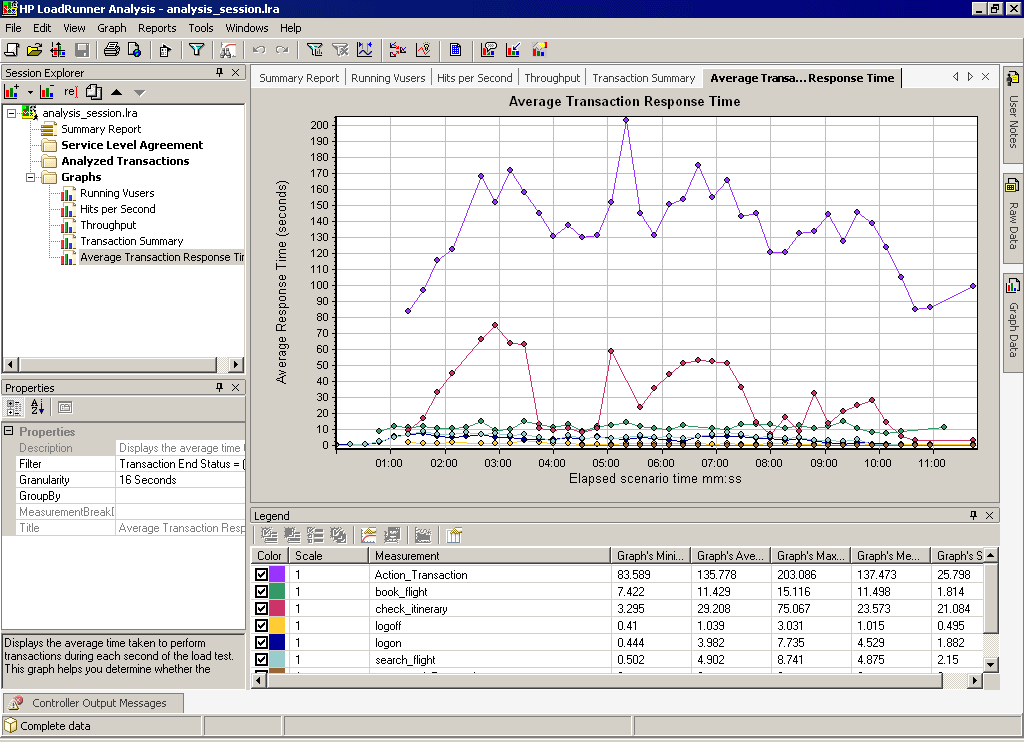
Analysis contains the following primary windows:
- Session Explorer
- Properties window
- Graph Viewing Area
- Graph Legend

- Session Explorer pane. In the upper left pane, Analysis shows the reports and graphs that are open for viewing. From here you can display new reports or graphs that do not appear when Analysis opens, or delete ones that you no longer want to view.
- Properties window pane. In the lower left pane, the Properties window displays the details of the graph or report you selected in the Session Explorer. Fields that appear in black are editable.
- Graph Viewing Area. In the upper right pane, Analysis displays the graphs. By default, the Summary Report is displayed in this area when you open a session.
- Graph Legend. In the lower right pane, you can view data from the selected graph.
There are additional windows that can be accessed from the toolbar that provide additional information. These windows can be dragged and dropped anywhere on the screen.
Service Level Agreement (Did I reach my goals?)
SLAs are specific goals that you define for your load test scenario. Analysis compares these goals against performance-related data that LoadRunner gathers and stores during the run, and then determines the SLA status (Pass or Fail) for the goal.
For example, you can define a specific goal, or threshold, for the average transaction response time measurement for any number of transactions in your script.
After the test run ends, LoadRunner compares the goals you defined against the actual recorded average transaction response times. Analysis displays the status of each defined SLA, either Pass or Fail. For example, if the actual average transaction response time did not exceed the threshold you defined, the SLA status will be Pass.
As part of your goal definition, you can instruct the SLA to take load criteria into account. This means that the acceptable threshold will vary depending on the level of load, for example, Running Vusers, Throughput, and so on. As the load increases, you can allow a higher threshold.
Depending on your defined goal, LoadRunner determines SLA statuses in one of the following ways:
- SLA status determined at time intervals over a timeline. Analysis displays SLA statuses at set time intervals (for example, every 5 seconds) over a timeline within the run.
- SLA status determined over the whole run. Analysis displays a single SLA status for the whole scenario run.
SLAs can be defined before running a scenario in the Controller, or after in Analysis itself.
| About Load Runner | Creating scripts in Load Runner | Load Runner scenario | LR Analysis | Performance Tuning | Performance Testing | LR Errors | Interview Question | Load Runner Tool | Correlation Practice | Site Map |