LoadRunner Analysis : How to define an SLA?
You will define an SLA in Analysis after the scenario run.
The average transaction response times will be measured at set time intervals within the run.
To define an SLA:
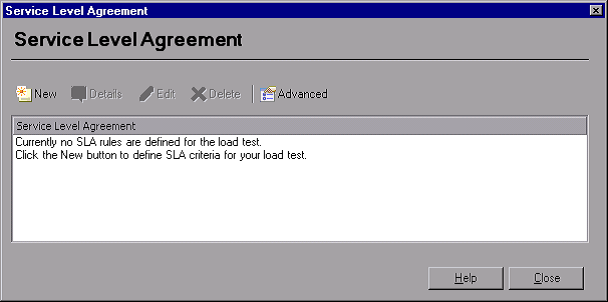
1. Open the SLA Configuration Wizard.
Select Tools > Configure SLA Rules. The Service Level Agreement dialog box opens. Click New to open the wizard.
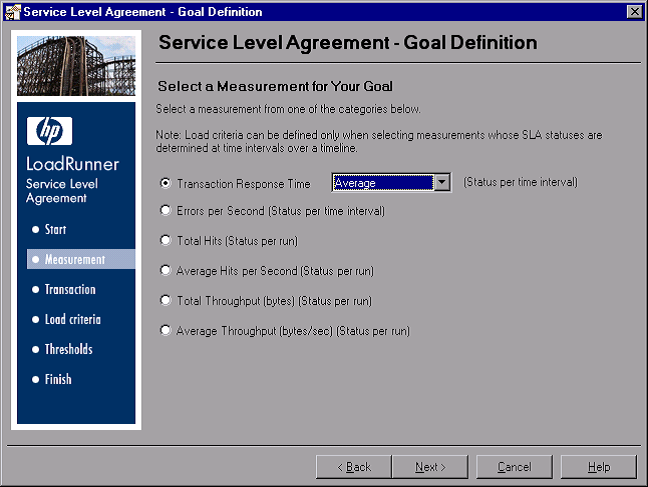
2. Select a measurement for your goal.
In the Select a Measurement for Your Goal page, select Transaction Response Time: Average. Click Next.
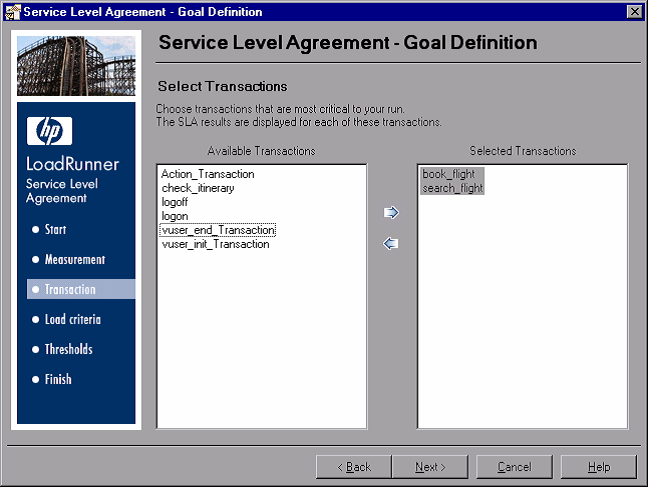
3. Select transactions to monitor.
In the Select Transactions page, you select the transactions you would like to monitor from the Available Transactions list, which is a list of all the transactions in the script. Double-click the book_flight and search_flight transactions to select them. Click Next.
4.Set the load criteria.
In the Set Load Criteria page, you instruct the SLA to take different load scenarios into account.
Select Running Vusers from the Load Criteria drop down list and set the Load Values to look like the following example:
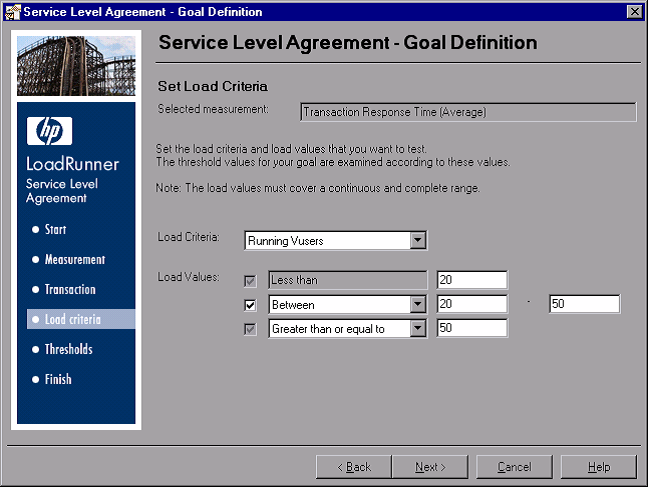
You just set the SLA to determine an acceptable average transaction response time over three potential load scenarios:
- Light load. Between 0 and 19 Vusers
- Average load. Between 20 and 49 Vusers
- Heavy load. More than 50 Vusers
5. Set threshold values.
In the Set Threshold Values page, you define the acceptable average transaction response times for the book_flight and search_flight transactions.
Set the threshold values to look like the following example:
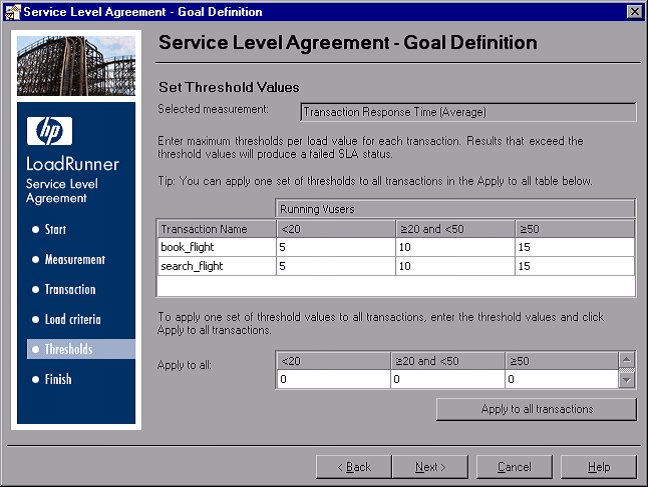
- Light load. 5 seconds or less
- Average load. 10 seconds or less
- Heavy load. 15 seconds or less
Note: Threshold values for selected transactions do not have to be the same. You can assign different values for each transaction.
7. Save the SLA.
To save the SLA and close the wizard, click Next then Finish then Close on the pages that follow.
Analysis applies your SLA settings to the default Summary Report. The report is then updated to include all the relevant SLA information.
Summary of performance
The Summary Report tab displays general information and statistics about the scenario run, as well as all relevant SLA information. For example, what were the worst performing transactions in terms of defined SLAs, how specific transactions performed over set time intervals, and overall SLA statuses. You open the Summary report from the Session Explorer.
The report contains the following sections:
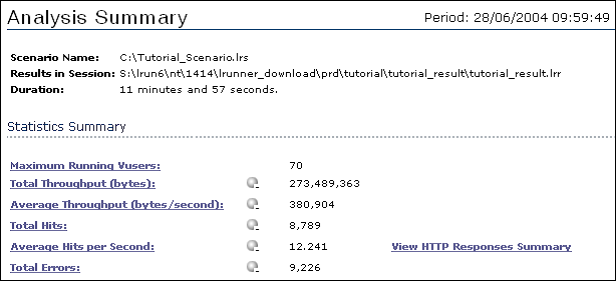
What are the overall scenario statistics?
In the Statistics Summary section, you can see that a maximum of 70 Vusers ran in this test. Other statistics such as the total/average throughput, and the total/average hits are also logged here for your information.
What were the worst performing transactions?
The 5 Worst Transactions table shows you up to five worst-performing transactions for which SLAs were defined.
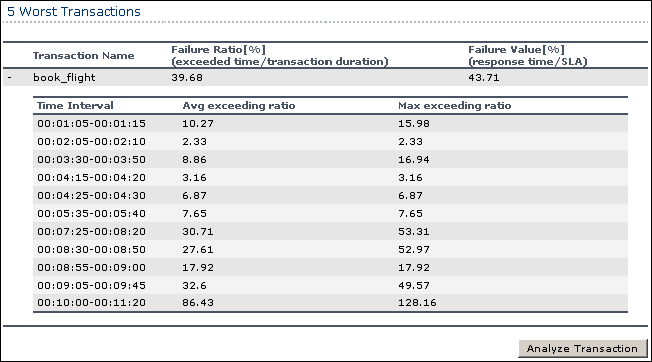
You can see that over the duration of the book_flight transaction, the SLA threshold was exceeded 39.68% of the time. The average percentage by which it exceeded the SLA threshold over the whole run was 43.71%.
Over which time intervals was the SLA threshold exceeded?
The Scenario Behavior Over Time section shows how each transaction performed during different time intervals. The green squares show time intervals where the transaction performed within the SLA threshold, red squares where the transaction failed, and grey squares where no relevant SLA was defined.
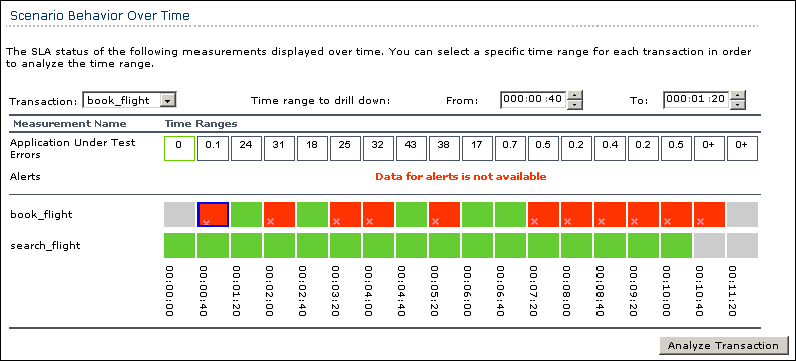
You can see that of the two transactions for which you defined SLAs, search_flight was within the threshold over all the measured time intervals, while book_flight exceeded the threshold in several intervals.
What was the overall transaction performance?
The Transaction Summary lists a summary of the behavior of each transaction.
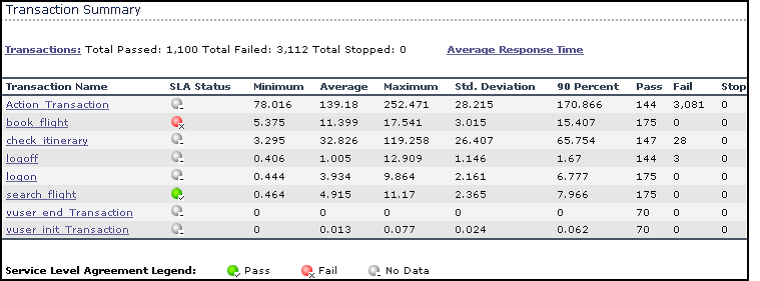
Review the response times of each transaction. The 90 Percent column displays the response time of 90% of the executions of a particular transaction. You can see that 90% of the check_itinerary transactions that were performed during the test run had a response time of 65.754 seconds.
This is double its average response time, 32.826, which means that the majority of occurrences of this transaction had a very high response time.
We also see that this transaction failed 28 times.
Note how the SLA Status column shows the relevant overall SLA statuses:
Fail for book_flight and Pass for search flight.
| About Load Runner | Creating scripts in Load Runner | Load Runner scenario | LR Analysis | Performance Tuning | Performance Testing | LR Errors | Interview Question | Load Runner Tool | Correlation Practice | Site Map |